STORM won a climate computing prize after tests on four hurricanes and two episodes of extreme heat showed how observations can sharpen a model’s picture of the atmosphere.

Before a computer can forecast where a hurricane will go, it needs to know where the storm is now. On Thursday in Chicago, a team working on that first problem won the 2026 ACM Gordon Bell Prize for Climate Modelling.
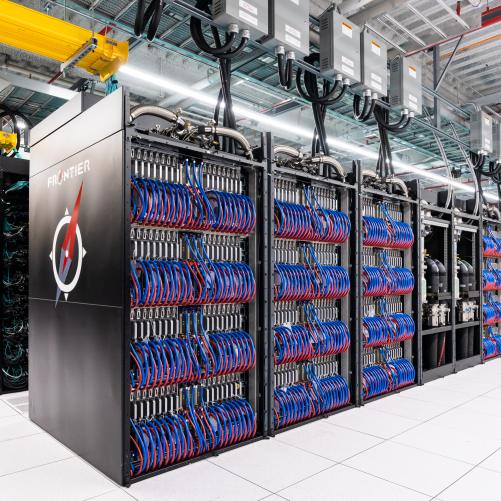
Its software, called STORM, used the Frontier supercomputer in Tennessee to generate 32,768 possible weather states in 34 seconds in one test. Each state represented a different answer compatible with the information the researchers supplied.
The distinction between a forecast and its starting point can sound rather academic until a storm is offshore. A small difference in the estimated position of its centre can put a different stretch of coast in its projected path. Winds near the centre are especially hard to pin down. A satellite sees much of the ocean, a buoy samples the water and air at one location, and ground stations are concentrated on land. None has a complete view of the atmosphere at the same instant.
Weather services reconcile those measurements with what an earlier forecast says should be happening. Meteorologists call the resulting estimate an analysis, and the work of producing it data assimilation.
A reading can be unusually high because a sensor is wrong or because a storm really is gathering strength. Observations elsewhere, the known uncertainty of the instrument and the recent behaviour of the atmosphere help determine how much weight to give it.
A way to keep several possibilities in play
One familiar approach starts by running a collection of slightly different forecasts forward. It then updates them with new observations. Repeating the exercise with more members gives scientists a better chance of seeing a plausible but unusual outcome. It also adds to the work of moving information across a machine. Processors can spend time waiting for one another as each group finishes its forecast and passes the results on for correction.
STORM reorganises that calculation. Researchers trained a model to recognise patterns over time and space, then used a process called diffusion to draw possible states consistent with historical context and the available measurements.
A single calculation can produce many different answers because the evidence leaves room for more than one. Their spread tells researchers something a lone, neatly drawn storm track cannot convey. It shows where the same starting evidence permits materially different interpretations.
The name stands for Spatiotemporal Transformer for Earth System Modeling. A transformer can determine which parts of an input matter to one another. A straightforward way to do that would compare every piece of the weather map with every other piece, including pieces from earlier maps. Double the number of pieces and the number of possible pairings grows roughly fourfold. A longer weather history can therefore use up the memory that might otherwise buy a finer map.
The team divided its maps into overlapping tiles. During the calculation, adjacent tiles exchange information in the areas they share. Over successive updates, a change can travel beyond its original neighbourhood. The researchers report that the cost of this part of their method rises roughly in step with the amount of input.
On Frontier, they could also give different processors different possible weather states to work on at the same time. The 34-second ensemble test used 4,096 graphics processing units as counted by the team.
Four hurricanes provide a check
To see whether the extra computing power produced a more faithful picture, the researchers revisited Hurricane Michael in 2018 and Laura, Delta and Teddy in 2020. They ran the model with and without information drawn from an existing reconstruction of the atmosphere, then compared the paths with the US National Hurricane Center’s historical tracks. The two runs used the same model. That allowed the researchers to isolate the difference that feeding it observations made.
The results varied by storm. For Delta, providing a tenth of the observations in the experiment scarcely changed the score used to assess the possible tracks. Providing a fifth brought a substantial improvement.
For Michael and Laura, even the smaller fraction helped. All four showed better scores at the higher level of coverage. The exercise also exposed a weakness in the forecast-only version for Laura, where it underestimated peak winds on average.
There is a practical reason to look at the whole set of tracks. Two systems can put a storm’s most likely position in much the same place while giving very different odds to a sharp turn. An evaluation that considers the range of outcomes can distinguish between them.
These were reconstructions of known hurricanes with selected inputs and reference tracks available afterwards. An operational warning desk would face fresh storms, late reports and instruments that might fail when they matter most.
Looking back at heat as well as wind
The same idea has a role in climate archives. Reanalysis applies a consistent method across past observations to reconstruct weather from one week, or one decade, to the next. The researchers tested weekly temperatures near ground level in Africa, South America and South Asia using years held back from training. Of the configurations they compared, the one that used two years of historical context and produced four weeks of output had the lowest errors across those regions.
Two exceptional periods gave the researchers a tougher test. During Australia’s Black Summer of 2019–20 and Siberia’s prolonged warmth in 2020, the forward simulation tended to pull temperatures back towards familiar seasonal values.
As the team supplied a larger share of observations, its reconstruction moved closer to the reference temperatures. The spread of the estimates narrowed too. That pairing matters in an archive where an apparently unremarkable weekly average could hide the very event a researcher wants to study.
The work also points back to an investment outside the computer room. In a separate study this month, the European Centre for Medium-Range Weather Forecasts simulated filling gaps in observing networks. It found that expanding surface and upper-air coverage in Pacific small island developing states could cut forecast uncertainty by as much as a fifth under the conditions tested. Even very fast software depends on someone measuring the wind or temperature in a place where the available evidence is thin.
The Chicago prize recognised a collaboration of thirteen researchers from Oak Ridge National Laboratory, several universities and AMD. Their most memorable number may be 34 seconds, but one of their most telling results came from Delta. The same model, asking the same question about the same storm, gave a much better account of its path once it had more evidence. Frontier made it possible to examine thousands of answers. The observations helped decide which ones deserved belief.